HTML5 Canvas : Deformation And Transformation
The displacement
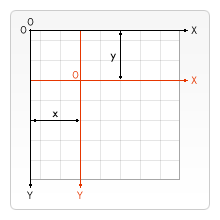
HTML5 canvas provides a translate method, which can remap the (0,0) position on the canvas. When drawing a graph again, the position will be drawn relative to the new origin, resulting in the effect of displacement.
Related methods:
//Remap the (0,0) position on the canvas.
//x: value added to horizontal coordinate (x)
//y: value added to vertical coordinate (y)
context.translate(x, y);
For example:
var canvas=document.getElementById("myCanvas");
var ctx=canvas.getContext("2d");

ctx.fillRect(30,30,60,60);
ctx.translate(70,70);
ctx.fillRect(30,30,60,60);

Zoom
HTML5 canvas provides the scale method to increase or decrease the number of pixels contained in the drawing unit factor of a drawing, and to reduce or enlarge the shape and bitmap.
By default, a unit in canvas is actually a pixel. For example, if we use 0.5 as the scaling factor, the final unit will become 0.5 pixels, and the size of the shape will become half of the original size. In a similar way, if we use 2.0 as the scaling factor, we will increase the unit size to two pixels. The size of the shape will double.
Related methods:
//Zoom current drawing
//scalewidth: scale the width of the current drawing (1 = 100%, 0.5 = 50%, 2 = 200%...)
//scaleheight: scale the height of the current drawing (1 = 100%, 0.5 = 50%, 2 = 200%...)
context.scale(scalewidth, scaleheight);
For example:
var canvas=document.getElementById("myCanvas");
var ctx=canvas.getContext("2d");

ctx.fillRect(10,10,10,10);
ctx.scale(3, 3);
ctx.fillRect(10,10,10,10);
ctx.scale(1, 3);
ctx.fillRect(10,10,10,10);

As can be seen from the above figure, if we scale the drawing, all subsequent drawings will also be scaled. Positioning is also scaled. If you use scale (3, 3), the drawing will be positioned three times from the top left corner of the canvas. When we call this method again, it scales based on the last scale.
Rotation
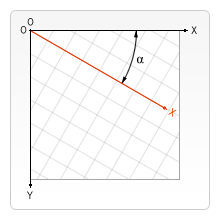
HTML5 canvas provides a 'rotate' method to rotate the coordinate axis. When drawing a graph again, the position will be drawn relative to the new coordinate axis, thus producing the effect of rotation.
Related methods:
//Rotate the current drawing
//angle: rotation angle in radians.
//To convert an angle to radians, use the equations degrees*Math.PI/180.
//For example, if you need to rotate 5 degrees, you can specify the following formula: 5*Math.PI/180.
context.rotate(angle);
For example:
var canvas=document.getElementById("myCanvas");
var ctx=canvas.getContext("2d");

ctx.fillRect(20,10,100,30);
ctx.rotate(45 * Math.PI /180); //Displacement rotation 45 degrees
ctx.fillRect(60,0,100,30);

Deformation
Each shape on the canvas has a transformation matrix. HTML5 canvas provides a transform method to control the transformation matrix of the graphics in the canvas, and the graphics can be deformed by replacing the transformation matrix.
By using the transform method, you can achieve all the effects described previously, including scaling, rotating, moving, and tilting the current environment.
Related methods:
//Replace the current transformation matrix
//                 a c e
//Description of transformation matrix: [b d f]
//                 0 0 1
//a: scale horizontally
//b: horizontal tilt
//c: vertical tilt
//d: vertical scaling
//e: horizontal movement
//f: vertical movement
ctx.transform(a, b, c, d, e, f);
For example:
var canvas=document.getElementById("myCanvas");
var ctx=canvas.getContext("2d");

ctx.fillRect(50,30,50,50);
ctx.transform(1,1,0,1,0,0);
ctx.fillRect(50,50,50,50);

var canvas=document.getElementById("myCanvas");
var ctx=canvas.getContext("2d");
ctx.fillStyle="yellow";
ctx.fillRect(0,0,150,50)

ctx.transform(1,0.5,-0.5,1,0,0);
ctx.fillStyle="red";
ctx.fillRect(0,0,150,50);

ctx.transform(1,0.5,-0.5,1,0,0);
ctx.fillStyle="blue";
ctx.fillRect(0,0,150,50);
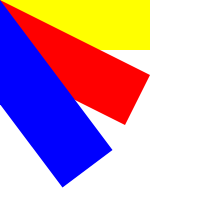
As can be seen from the above figure, when we call this method multiple times, it will transform based on the last transformation.
Note: the behavior of the transform() method will be relative to the complete overlay deformation effect of rotate(), scale(), translate(), and transform(). For example: if we set the plot to double, and then use the transform () method to double the plot, the final plot result will be quadrupled.
Set deformation matrix
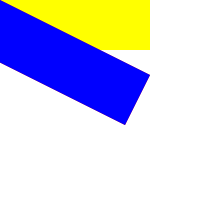
The 'settransform' method provided by HTML5 canvas is used to reset and create a new transformation matrix. It will overwrite the original matrix and will not transform based on the previous transformation.
Related methods:
//Set new transformation matrix
context.setTransform(a, b, c, d, e, f);
For example:
var canvas=document.getElementById("myCanvas");
var ctx=canvas.getContext("2d");
ctx.fillStyle="yellow";
ctx.fillRect(0,0,150,50)

ctx.setTransform(1,0.5,-0.5,1,0,0);
ctx.fillStyle="red";
ctx.fillRect(0,0,150,50);

ctx.setTransform(1,0.5,-0.5,1,0,0);
ctx.fillStyle="blue";
ctx.fillRect(0,0,150,50);
- Link : https://www.zdyla.com/en/post/html5-canvas-transformation.html
- Copyright Notice : Unless otherwise stated, please contact the author for authorization and indicate the source!